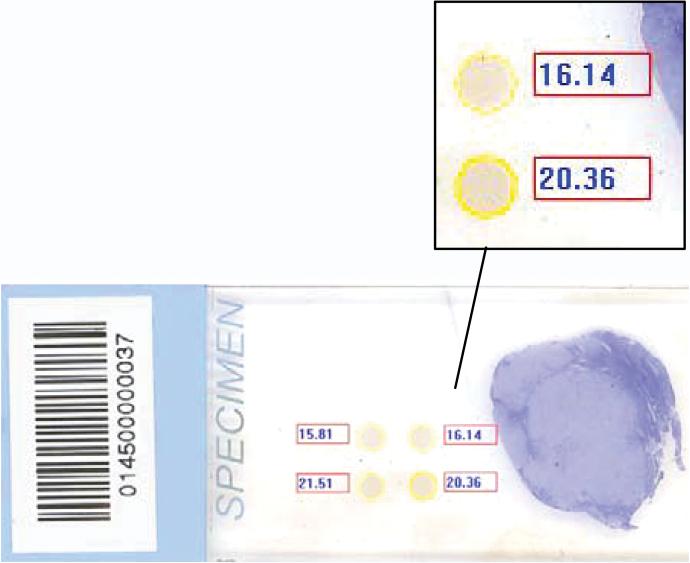
Figure 2.
Software program screen for measuring stained peptide spot intensity. After subtracting the background level of intensity over irrelevant areas of the slide (not shown), color intensity is measured over the stained peptide spots (contained within the yellow circles). The value, in mean pixel intensity, is depicted in the higher magnification inset. The peptide control spots shown in the inset are not duplicates of each other, but rather serial dilutions. Duplicate peptide controls were printed with a horizontal orientation on the slide.

