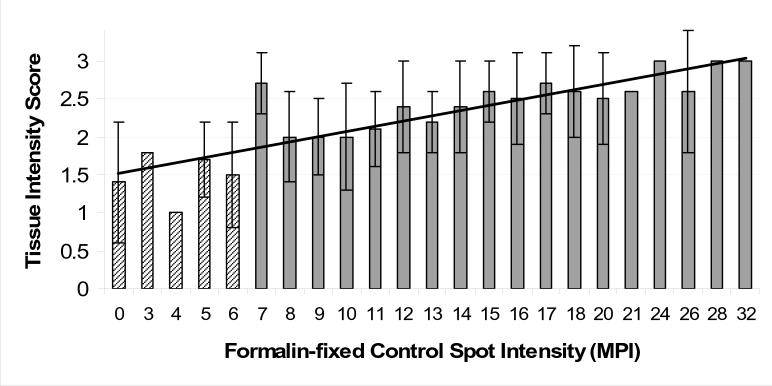
Figure 6.
Relationship of the HER-2 staining intensity of a 3+ tissue biopsy section to the staining intensity of a 50 micromolar HER-2 peptide control spot on a glass microscope slide. The peptide spot intensities (x axis) are measured in units of mean pixel intensity (MPI). When error bars are shown, then the value represents the mean ± SD of more than one participating laboratory for that level of HER-2 peptide staining. The absence of an error bar means that only one laboratory returned a HER-2 peptide control value at that particular level of staining (expressed as “mean pixel intensity”, on the x axis). We fit the data with a best-fitting curve using a linear regression line.

