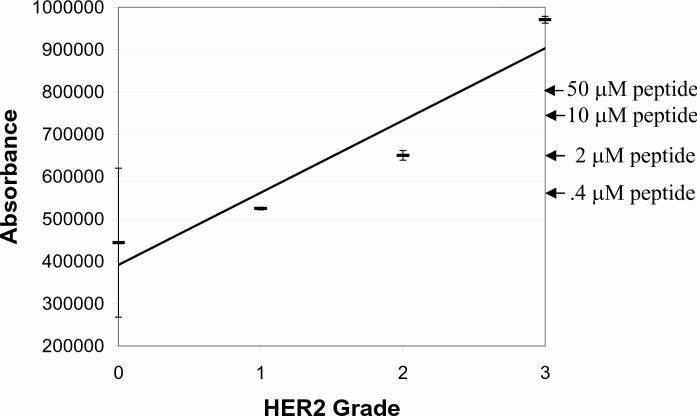
Figure 7.
Image intensity comparison between peptide IHC controls (50, 10, 2, and 0.4 μM concentration, whose intensities are shown at the right by the arrows) and HER-2 cell lines previously calibrated to 0, 1+, 2+, and 3+ staining intensity. The regression line has a correlation coefficient (r) = 0.95. The absorbance units on the y axis are relative units generated by the iCys laser scanning Cytometer.

