Figure 1.
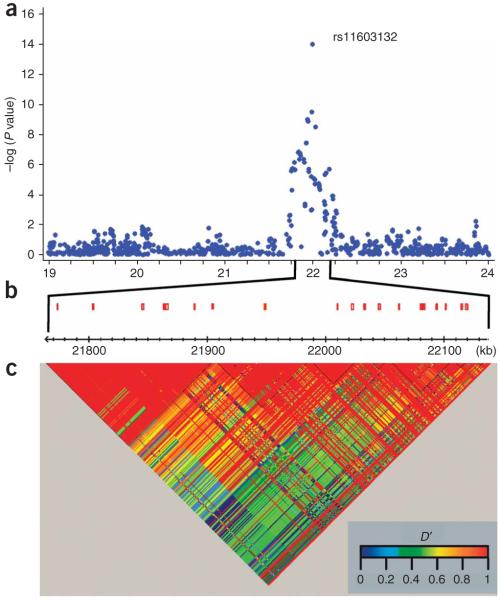
Association between SNPs near chromosome 20p11.22 and androgenic alopecia. (a) −log (P value) measures for association between SNPs and chromosomal position. (b) Recombination hot spots (HapMap CEPH population, NCBI build 36). (c) Linkage disequilibrium in GOLD heat map Haploview 4.0 color scheme, CEPH population. The x axis represents genomic position in Mb (a) and in kb (b,c). All P values are derived from the CoLaus cohort, except that for the lead SNP, rs11603132, which is derived from the combined P value from the CoLaus, TwinsUK, Icelandic and Dutch cohorts.

