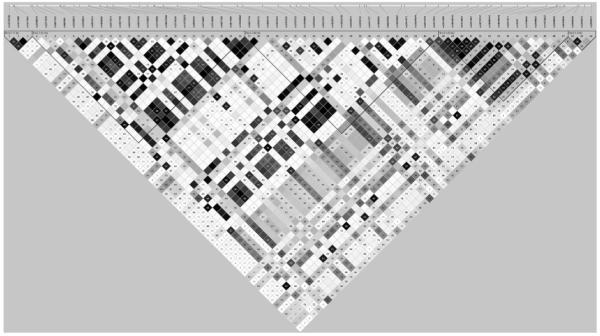
FIG. 2.
Linkage disequilibrium structure of 64 typed markers in the Utah Caucasian sample. Image is taken from HaploView 3.32 for the 64 SNPs typed by the International Type 2 Diabetes 1q Consortium and/or in house. Blocks are defined using the solid spline of linkage disequilibrium. Shades of gray refer to the strength of pairwise linkage disequilibrium based on r2, and numbers refer to pairwise D′ values. Black squares indicate r2 ~1, white squares are very low values of r2. Squares without numbers indicate D′ values of 1.00, and all lower values are indicated.

