Figure 2.
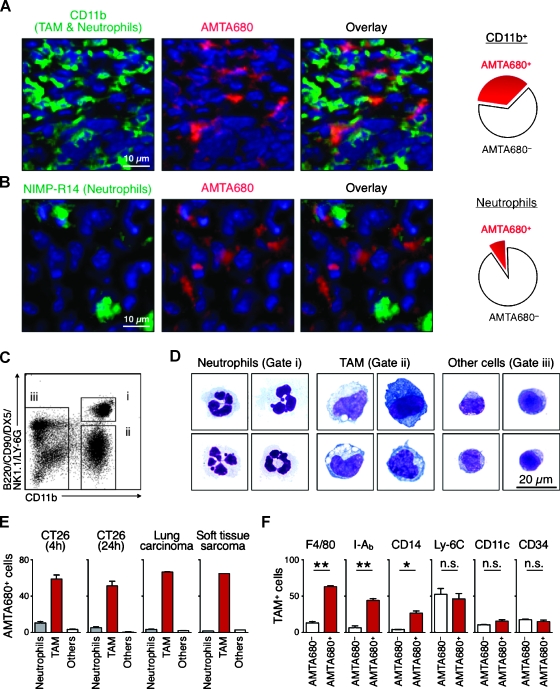
AMTA680 preferentially labels TAMs with an “M2-like” phenotype. Immunofluorescence analysis of frozen sections from nonfluorescent CT26 tumors labeled with anti-CD11b (A) or NIMP-R14 (B) mAb. DAPI is shown in blue. During image acquisition, the signal integration times required to detect AMTA680 in (B) were an order of magnitude lower than in (A) suggesting that the few AMTA680-positive neutrophils contain less AMTA680 than TAMs, n = 3. (C) Flow cytometry analysis of cell suspensions of excised tumors identifies neutrophils (i), TAMs (ii), and other cells (iii). (D) Morphological analysis of sorted cells, n = 3. (E) Percentage of different cell types labeled with AMTA680 24 hours after administration of the agent in mice with subcutaneous CT26 (n = 4), lung carcinoma (n = 3), or soft tissue sarcoma (n = 1). Mice with subcutaneous CT26 were also tested after 4 hours (n = 4). (F) Surface phenotype of AMTA680+ and AMTA680- TAMs obtained from CT26 tumors and analyzed by flow cytometry 24 hours after administration of the agent. *P < .005, **P < .0005, n = 3.

