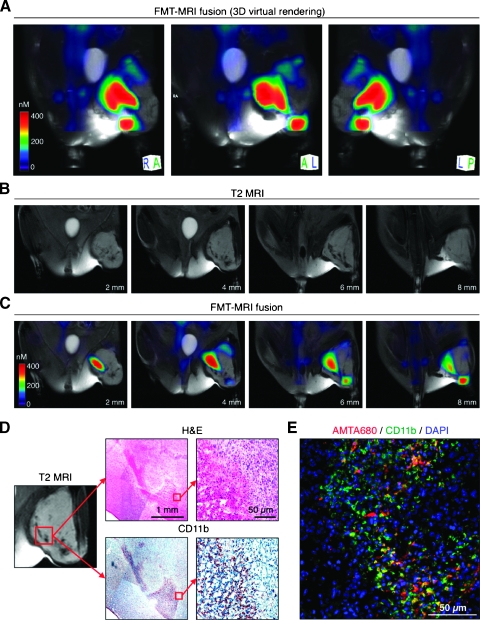
Figure 4.
Macroscopic imaging of TAMs distribution. A mouse with soft tissue sarcoma in the left crural muscle received AMTA680 intravenously and was analyzed 24 hours later with the following imaging modalities: (A–C) FMT, MRI, and FMT-MRI fusion. (A) Three-dimensional virtual rendering of TAMs using FMT-MRI fusion. The color-coded optical images use advanced algorithms [32] to reconstruct and quantitate three-dimensional maps of AMTA680. (B) Different sections of T2-weighted MRIs generated by the iron oxide superparamagnetic core of AMTA680. (C) Corresponding FMT-MRI fused sections. (D) Hematoxylin/eosin (H&E) and anti-CD11b staining in an AMTA680 rich region of the tumor as identified by MRI (and FMT). (E) Immunofluorescence analysis for colocalization of AMTA680+ and CD11b+ cells.

