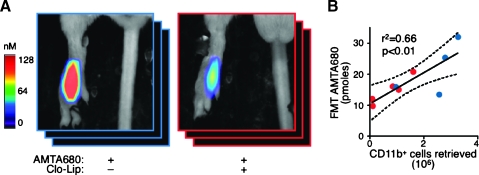
Figure 5.
In vivo imaging of anti-TAMs treatment. (A) In vivo FMT imaging of AMTA680-derived signal from the tumor site of CT26 tumor-bearing mice that received Clo-Lip on day 6 (red) or not (blue). All mice received AMTA680 intravenously on day 6 and were imaged by FMT on day 7. Clo-Lip-treated mice: n = 5, control mice: n = 4. (B) Positive and linear relationship between FMT-based AMTA680-derived signal and the number of CD11b+ cells retrieved from excised tumors and analyzed by flow cytometry.

