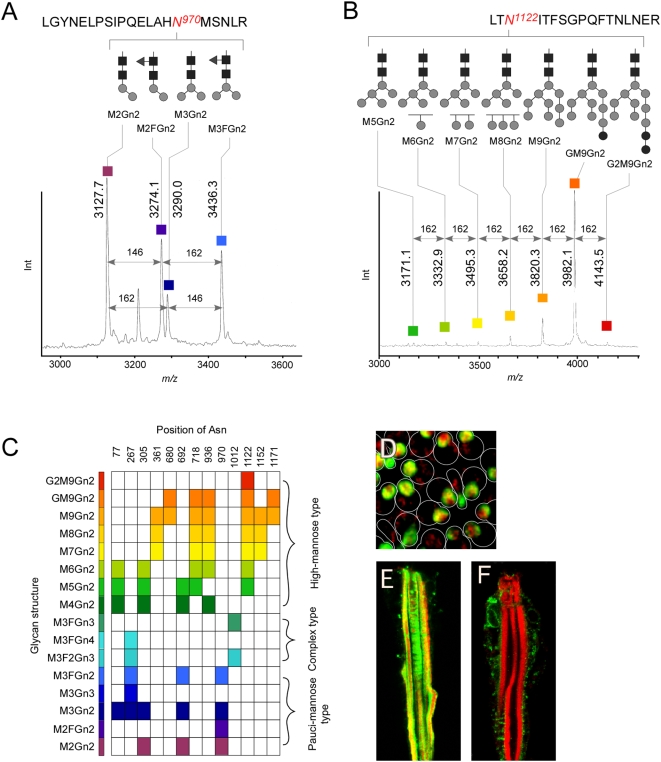
Figure 2. Mass spectra and structural variation of the N-glycans of chaoptin.
(A) Mass spectrum of a glycopeptide fraction containing pauci-mannose-type glycans following RP-HPLC. The structures of the 4 glycans observed at N970 are shown schematically. The glycopeptide signals are spaced by 162 amu (mannose, M) or 146 amu (fucose, F). (B) Mass spectrum of a glycoprotein fraction that contains high-mannose-type glycans in which 7 glycans are observed at N1122. The signals spaced by 162 amu correspond to a number of mannose (M) or glucose (G) residues. (C) Observed glycan structures at each glycosylation site are shown. The horizontal and longitudinal axes show the position of asparagine (Asn) in the polypeptide and glycan structures, respectively. Distinctive colors are assigned to the individual glycan structures, which are used in the paper hereafter. (D) The majority of Chp is localized in the rhabdomeres as determined by staining with anti-Chp antibody and Alexa Fluor 488-conjugated anti-mouse IgM. TMR (tetramethylrhodamine)-phalloidin staining against F-actin. (E) A longitudinal conforcal image: same staining as in D. (F) Photorecepter cells were stained (longitudinal image) using TMR-phalloidin and anti-KDEL antibody and Alexa-Fluor-488 conjugated anti-mouse IgG.

