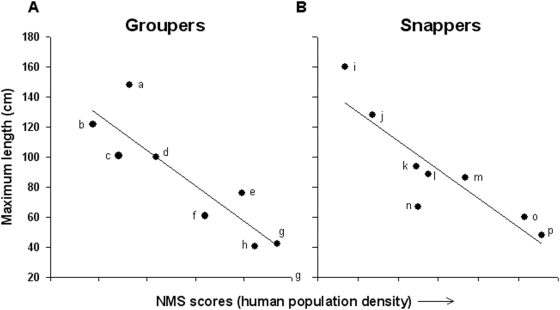
Figure 3. Maximum lengths of serranids and lutjanids as a function of human population density.
Taxon codes are in caption to Figure 2. Regression statistics (n = 8 species each): (A) serranid maximum published lengths (r2 = 0.78, p = 0.004); (B) lutjanid maximum published lengths (r2 = 0.78, p = 0.003). NMS scores are from the axis that accounted for the most variation in the data. Axis variation explained and correlation with human population density: (A) serranid ordination (axis r2 = 0.55, r with axis = 0.75); (B) lutjanid ordination (axis r2 = 0.46, r with axis = 0.50).

