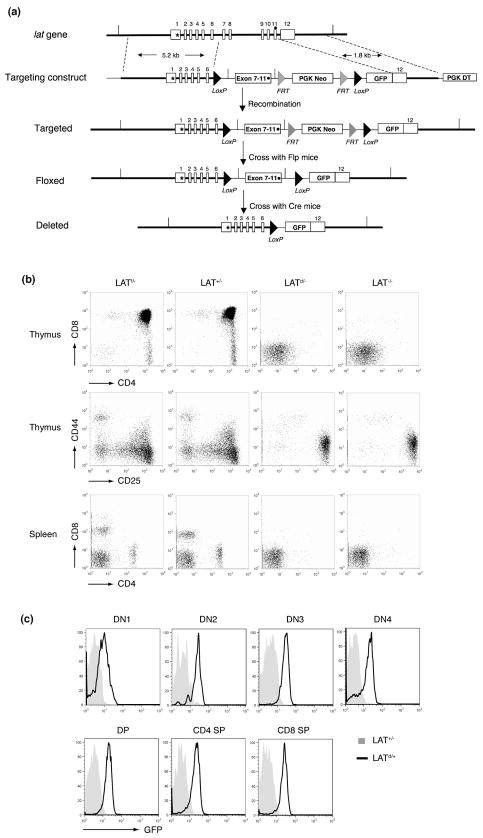
Figure 1. Generation of LAT knock-in mice.
(a). The LAT knock-in targeting strategy. Twelve lat exons are indicated. The initiation codon (*) is at the exon 1. The stop codon (·) is at the exon 11. Exon7–11 in the targeting construct was made from the corresponding lat cDNA fragment. The grey triangles represent the FRT sites. The black triangles represent the Loxp sites.
(b). T cell development in LATf/−, LAT+/−, LATd/− and LAT−/− mice. The thymi and spleens from 5-week old mice were analyzed by FACS. Top: the CD4 vs. CD8 profile of thymocytes. Middle: the CD25 vs. CD44 profile of the CD4−CD8− (DN) thymocytes. Bottom: the CD4 vs. CD8 profile of splenocytes.
(c). The GFP expression profile in different subsets of thymocytes from the age-matched LAT+/− and LATd/+ mice.

