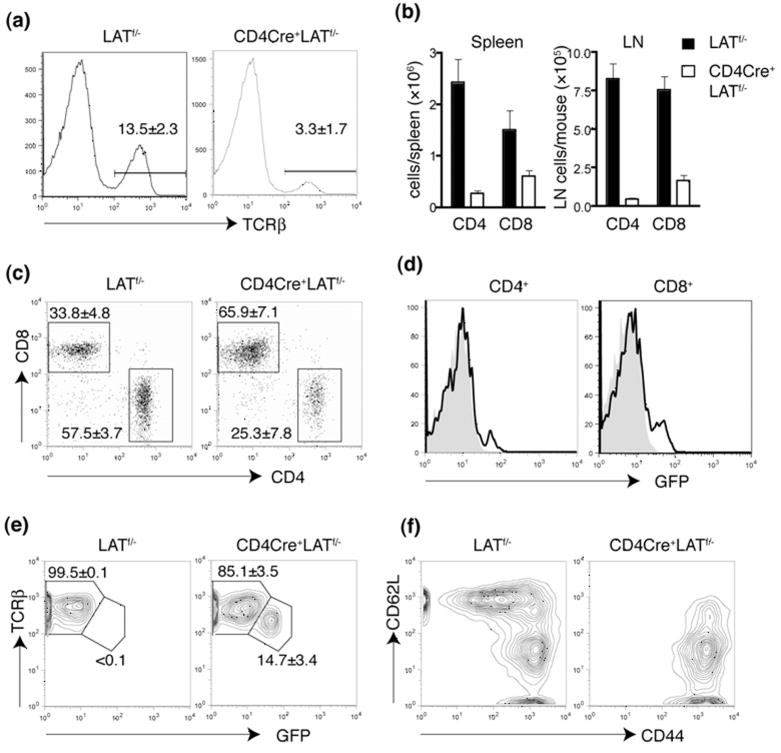
Figure 5. Abnormal T cells in the periphery of CD4Cre+LATf/− mice.
(a). Reduced number of mature T cells in the CD4Cre+LATf/− mice.
(b). The total numbers of CD4+ and CD8+ T cells in spleen and lymph nodes.
(c). The CD4 vs. CD8 expression profile of TCRβ+ splenocytes.
(d). GFP expression in splenic CD4+ and CD8+ T cells from the LATf/− (Grey) and CD4Cre+LATf/− (Solid line) mice.
(e). TCRβ expression in the splenic CD8+ T cells.
(f). The CD44 vs. CD62L expression profile of the splenic CD8+ T cells from the LATf/− and CD4Cre+LATf/− mice.

