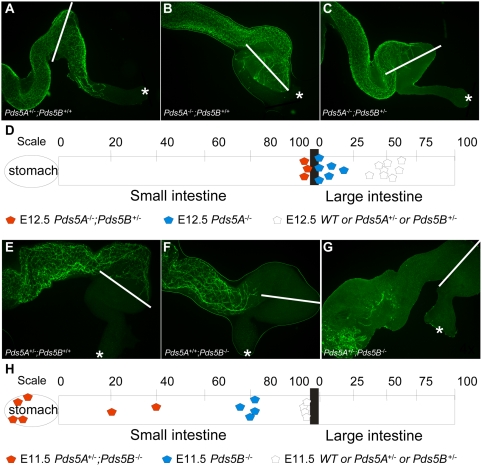
Figure 5. Synergistic effects of Pds5A and Pds5B deficiencies on enteric nervous system development.
(A–C) Whole mount TuJ1 immunofluorescent antibody staining of E12.5 gut highlights the enteric neurons (A, Pds5A +/−; B, Pds5A−/−; C, Pds5A−/−;Pds5B+/−). White bars define the ileocecal junction and an asterisk denotes the end of the colon. Enteric neurons colonize the bowel to the mid-colon in wildtype mice (A), but migrate only to the proximal colon or ileocecal junction in Pds5A−/− (B) and to near the ileocecal junction in Pds5A−/−;Pds5B+/− mice (C). Scale bars: 10 µm. (D) Schematic representation of the extent of bowel colonization by enteric neurons Pds5A−/− mice at E12.5. [WT (n = 8), Pds5A−/− (n = 6), and Pds5A−/−;Pds5B+/− (n = 3)]. The scale at the top corresponds to the percentage of the respective intestinal segment (small or large intestine) successfully colonized by neurons. (E–G) Whole mount TuJ1 immunofluorescent antibody staining of E11.5 gut highlights the enteric neurons in (E) Pds5A+/−, (F) Pds5B−/− and (G) Pds5A+/−;Pds5B−/− mutant mice. White bars define the ileocecal junction and an asterisk denotes the end of the colon. Note that the enteric neuron migration wavefront in wildtype mice reaches the ileocecal junction at this age while migration was delayed in Pds5B−/− mice. In Pds5A−/−;Pds5B+/− mice only a few enteric neurons in the stomach were detected and none had migrated into the intestine. Scale bars: 10 µm. (H) Schematic representation of ENS defects in Pds5A+/−;Pds5B−/− mice at E11.5 [WT (n = 4), Pds5B−/− (n = 4), Pds5A+/−;Pds5B−/− (n = 6)]. The scale at the top corresponds to the percentage of the respective intestinal segment (small or large intestine) successfully colonized by neurons.

