
Figure 2.
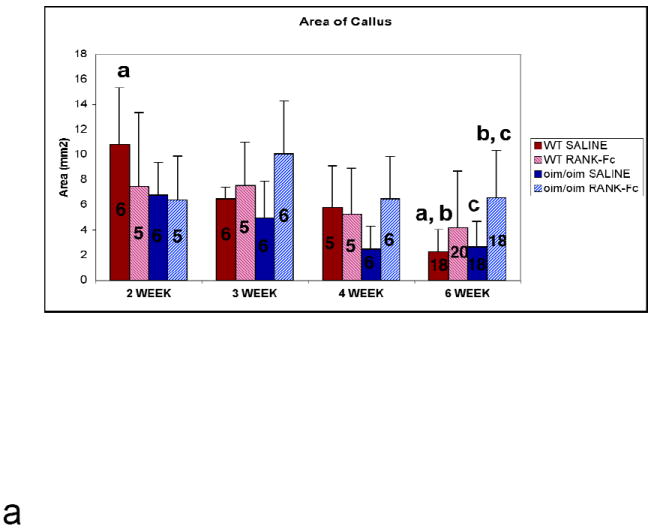
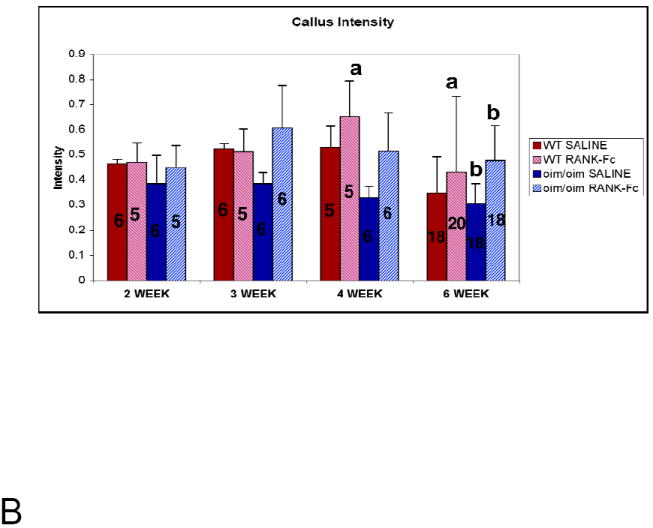
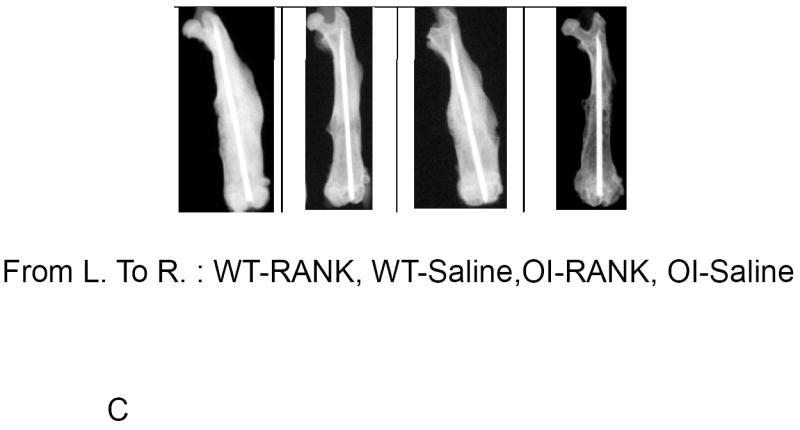
(A) Quantification of Callus Area by Radiographic Image Analysis. Saline-treated groups show a general decline in callus area from 2 weeks to 6 weeks post-fracture, whereas RANK-Fc treated groups demonstrate persistence of callus, with significantly greater callus area at 6 weeks post-fracture for the oim/oim RANK-Fc group compared to control. (Values shown are means ± standard deviation; values that are significantly different from each other are noted with matching lower case letters. Number per group is shown within each bar). (B) Quantification of Radiographic Intensity of Callus Callus intensity is significantly greater at 6 weeks post-fracture for the oim/oim RANK-Fc group compared to controls. (Values shown are means ± standard deviation; values that are significantly different from each other are noted with matching lower case letters. Number per group is shown within each bar). (C) Radiographs of Fractured Femora at 6 weeks Post-Fracture AP radiographs of femora taken 6 weeks post-fracture. Treatment with RANK-Fc leads to qualitative, visible differences in healing bone most readily observed in the oim/oim mice as increased callus area and intensity. (From left to right: WT RANK-Fc, WT Saline, oim/oim RANK-Fc, oim/oim Saline).