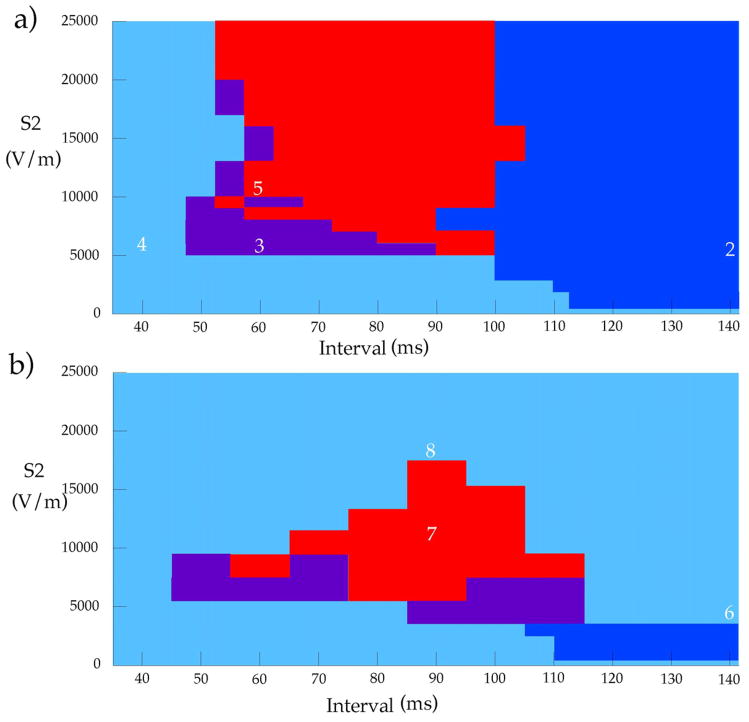
Figure 1.
The response of the tissue to an S2 shock, as a function of S2 strength and the S1-S2 interval. a) With a smooth fiber geometry, and b) with a smooth plus random fiber geometry. Light blue = no excitation, dark blue = make excitation, purple = break excitation, red = reentry. The white digits correspond to figure numbers illustrating that simulation. In b), whole tissue make excitation and no excitation are both shown in light blue. At intermediate S2 strengths there is an obvious difference between no excitation (short intervals) and whole tissue make excitation (long intervals), but at strong S2 strengths whole tissue make excitation and no excitation change continuously into one another.

