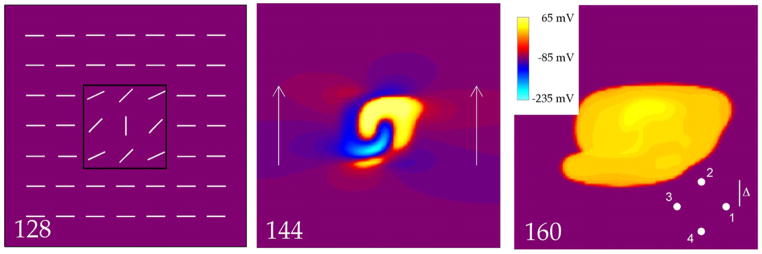
Figure 2.
The transmembrane potential as a function of position in a 20 mm × 20 mm sheet of cardiac tissue. The electric field has a strength of 5500 V/m, and is applied for 5 ms starting at 140 ms (the time of each frame in milliseconds is indicated by the number in the bottom left corner). The 128 ms frame shows the fiber geometry (white line segments), including the middle region (black box) where the fiber angle varies. The 144 ms frame shows the tissue response during the shock. The arrows indicate the direction of the applied electric field. The 160 ms frame indicates that the shock created a closed, outwardly propagating wave front (make excitation). This frame also shows the recording site geometry used to measure conduction velocity (the separation between electrodes, 2Δ, has been exaggerated for better viewing). The inset shows the color scale used in all figures (in some figures, Vm is outside the range of −235 to 65 mV during the S2 shock, and the color scale saturates). The supplemental file Fig2Video.avi contains a video of this simulation.

