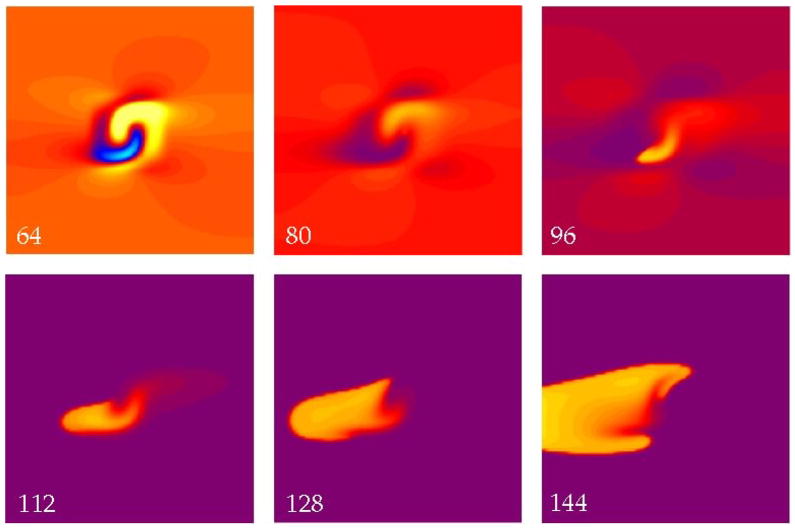
Figure 3.
The transmembrane potential as a function of position in a sheet of cardiac tissue. The electric field has a strength of 5500 V/m and is applied at a time of 60 ms. The hyperpolarized (blue) region in the 64 ms frame creates a excitable path through which a wave front can propagate (96 ms), resulting in break excitation. No reentry occurs. The color scale and fiber geometry are shown in Fig. 2. The supplemental file Fig3Video.avi contains a video of this simulation.

