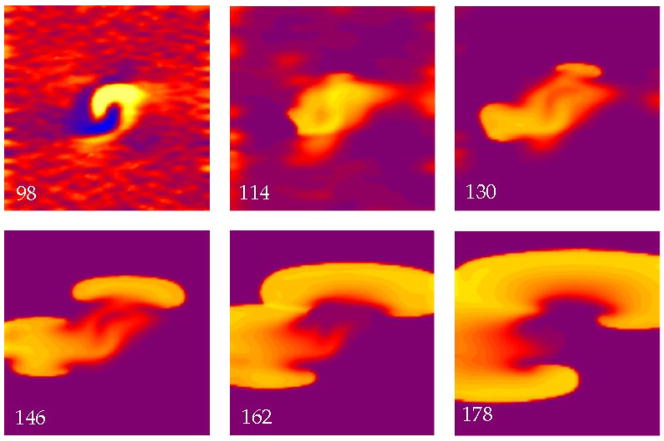
Figure 7.
The transmembrane potential as a function of position in a sheet of cardiac tissue. The electric field has a strength of 10,500 V/m and is applied at a time of 90 ms. Throughout the tissue a random distribution of fiber angles was added in addition to the fiber geometry shown in Fig. 2. Break excitation leads to figure-of-eight reentry. The color scale is shown in Fig. 2. The supplemental file Fig7Video.avi contains a video of this simulation.

