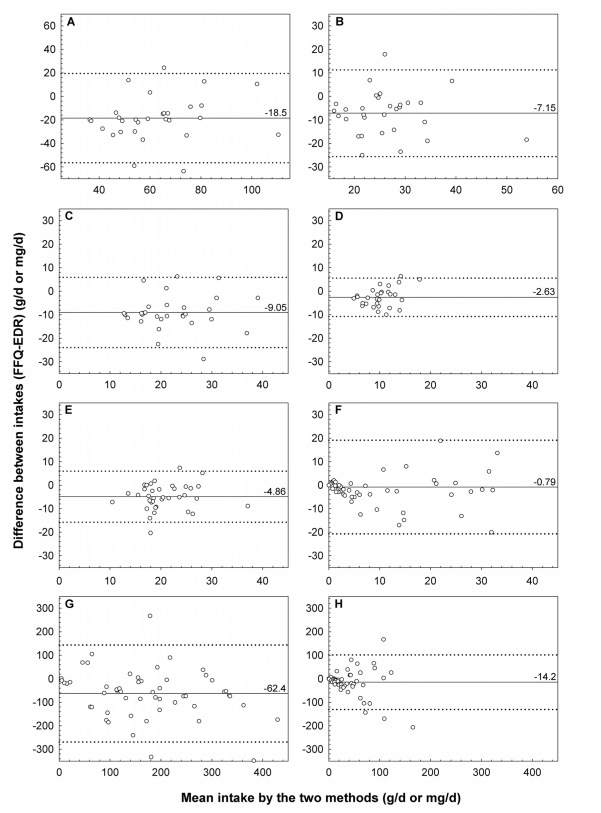
Figure 1.
Bland & Altman plots visualising the differences between the mean intake of (A) total fat, (B) saturated fatty acids, (C) mono-unsaturated fatty acids, (D) poly-unsaturated fatty acids, (E) fibres, (F) alcohol, (G) caffeine, and (H) theobromine calculated from the 7d estimated diet record (EDR) and the food-frequency questionnaire (FFQ) (—— mean difference; ····· mean difference ± 2 SD).

