Figure 1.
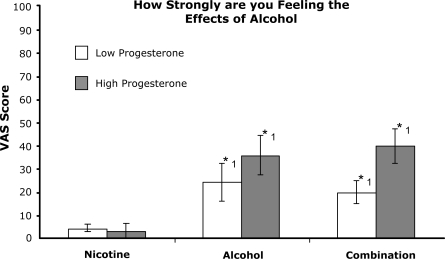
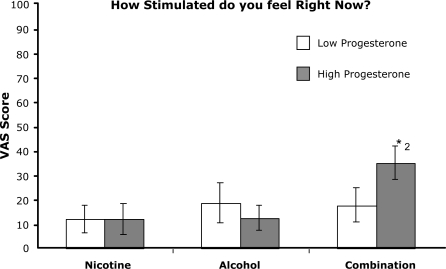
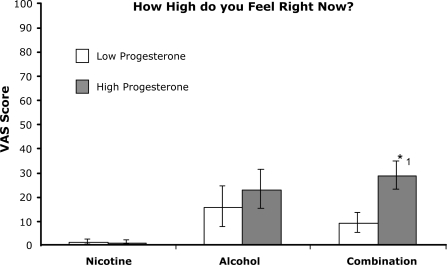
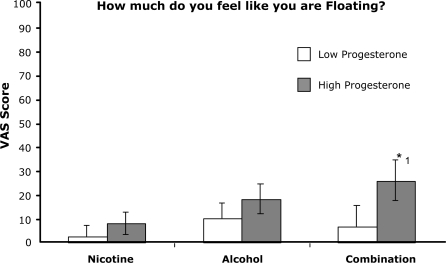
Peak effects scores for 4 scales of euphoric effects: A-Feeling Alcohol Effects; B-Stimulated; C-High; D-Floating. Participants rated their subjective effects on a 100 point scale from 0 – “not at all” to 100 – “extremely”. Columns are averages (± sem) by drug condition and progesterone group. *1: Drug condition significantly different from nicotine alone (p<.05). *2: Combination drug condition significantly different from nicotine alone and alcohol alone (p<.05).
a. Self-reported feelings of ‘alcohol effects’.
b. Self-reported feelings of ‘Stimulated’.
c. Self-reported feelings of ‘High’.
d. Self-reported feelings of ‘Floating’.


