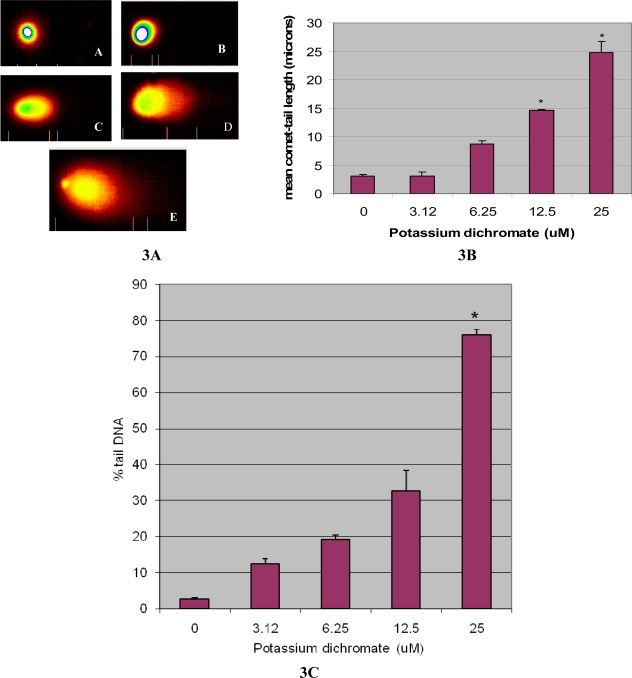
Figure 3.
(A) Single Cell Gel Electrophoresis assessment of potassium dichromate toxicity in human liver carcinoma cells (HepG2): A) Representative Comet images of control (A), and 3.12 μM (B); 6.25 μM (C); 12.5 μM (D) and 25 μM (E); 3(B): Effect of various doses of potassium dichromate and control on DNA migration in HepG2 cells at 48 h exposure; 3(C): Effect of various doses of potassium dichromate and control on the percent tail DNA. Each experiment was done in triplicate. Data were represented as means ±SDs. Statistical significance was indicated as (*) for (p< 0.05).

