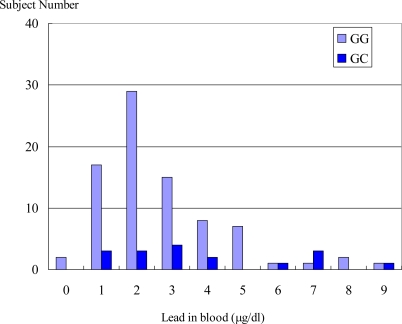
Figure 1.
Histogram of blood lead in all non-occupationally lead exposed participants. Vertical axis showed number of subjects divided by 10 individual each. Longitudinal axis showed concentration of blood lead (μg/dl). Vertical bar (light blue) showed GG genotype of ALAD gene, and vertical bar (dark blue) showed GC genotype of ALAD gene.

