
Figure 3.
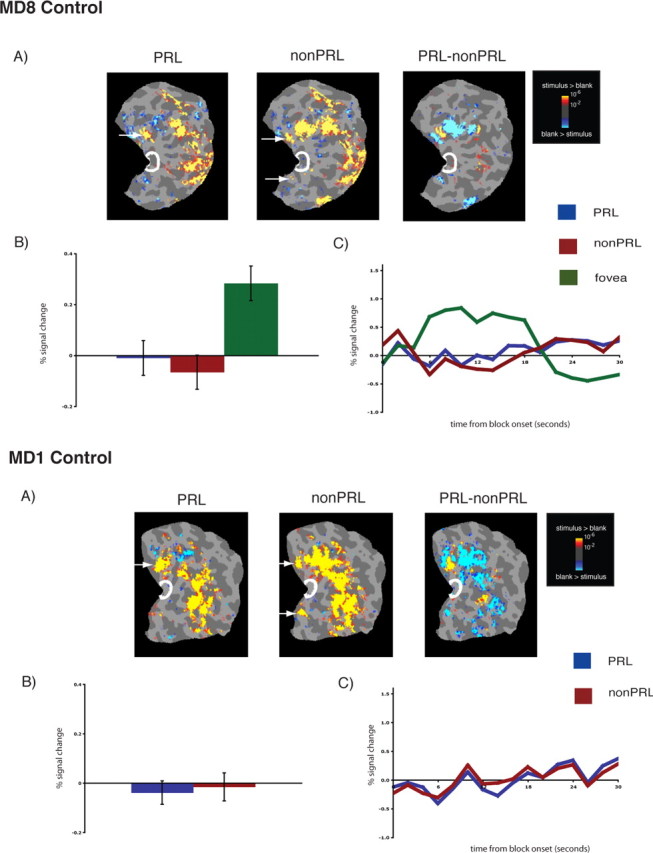
Lack of reorganization of visual processing in matched controls, labeled accordingly. A, Columns 1 and 2, Statistical parametric maps on the flattened cortex showing no activation at the occipital pole (white outlines show the occipital pole ROIs). The activation maps are displayed on the flattened cortex and show activation in response to visual objects presented at the PRL (column 2) and the non-PRL (column 3). In each case, activation was observed only in parts of cortex corresponding to the retinal location of the PRL and non-PRL (arrows), not at the occipital pole corresponding to the foveal confluence. A, Column 3, Statistical parametric map on the flattened cortex showing activation for the contrast of PRL versus non-PRL. This activation map shows the expected activation in response to visual objects presented at the PRL (yellow) and the non-PRL (blue). B, Bar chart showing percentage signal change (from fixation baseline) in the independently defined occipital pole ROI (white outlines on the statistical maps). Stimuli presented at the PRL (blue bar) and the non-PRL (red bar) elicited no discernable responses above baseline in the occipital pole ROI. In contrast, for MD8 Control, stimuli presented at the fovea elicited a strong response (green bar). C, Average time course of activation in the occipital pole ROI. There is no activation relative to the fixation baseline for stimuli presented at the PRL (blue line) and the non-PRL (red line) over the course of the blocks, and the expected activation for stimuli presented at the fovea.