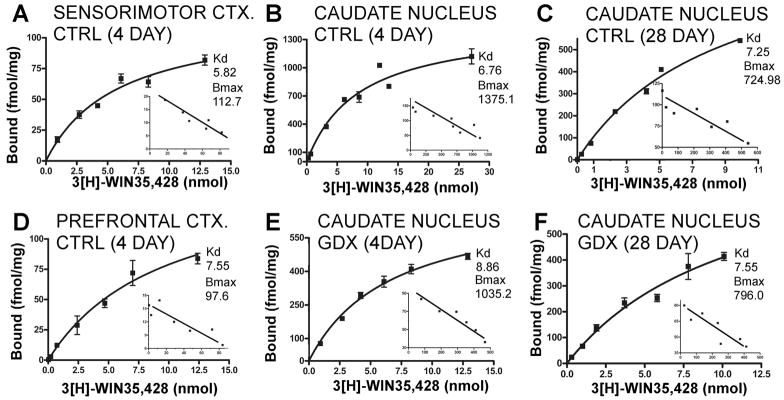
Figure 3.
Representative saturation isotherms with Scatchard transformations of the data shown as insets for 3H-WIN 35,428 binding. Each graph represents data from a single assay. For the saturation data, points are means of triplicate measures obtained of ligand bound in nmol/mg protein (Y-axis) at each ligand concentration (X-axis) and error bars are standard deviations of these means; the inserted Scatchard transformations plot corresponding measures of bound to bound/free ligand. Data from sensorimotor cortex (A), caudate nucleus (B) and prefrontal cortex (D) dissected from 4-day sham-operated controls (CTRL) are shown. For comparison, binding data for the caudate nucleus dissected from 28-day sham operated controls (C) and from 4- and 28 day gonadectomized animals (E, F) are shown. For each panel, calculated maximal numbers of binding sites (Bmax) and binding affinity constants (Kd) are also shown. These graphs illustrate that there can be variance in the data regarding measures of Bmax, e.g. compare 4 and 28-day controls, and linear regressions in the Scatchard plots that yield single straight lines indicative of binding to a single site.

