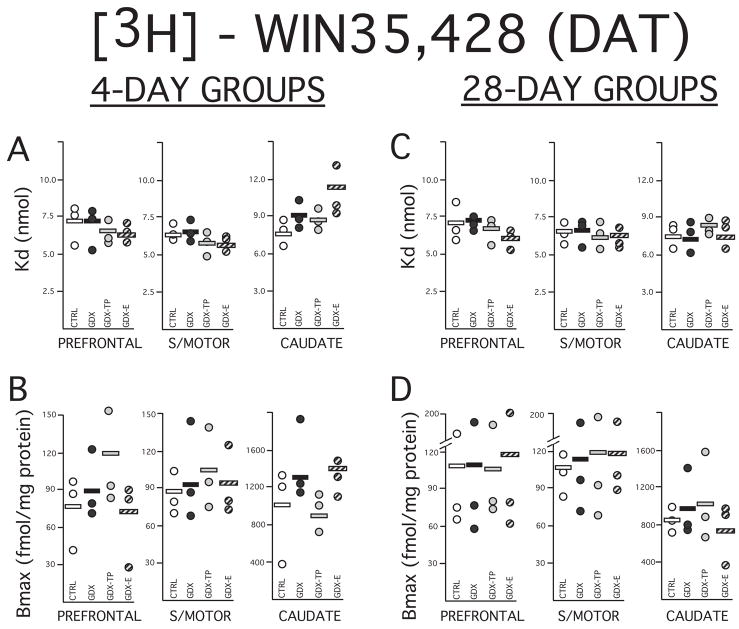
Figure 4.
Scatter plots showing data (circles) and means mean (horizontal black bars) for dissociation constants (Kd) in nmol (A, C) and maximal numbers of binding sites (Bmax) in fmol/mg protein (B,D) calculated for the dopamine transporter (DAT) using selective ligand 3H WIN35,428. The Kd and Bmax data obtained from homogenate assays performed on prefrontal cortex, sensorimotor cortex (S/MOTOR) and caudate nucleus tissue dissected from rats that were sham-operated (CRTL, open circles), gonadectomized (GDX, black circles) and gonadectomized and supplemented with testosterone propionate (GDX-TP, light gray circles) or estradiol (GDX-E, dark gray circles) for 4 (left) or 28 days (right) are shown separately. The paucity of the DAT in the cerebral cortex is reflected in Bmax values from both cortical samples that are lower than those obtained in the caudate nucleus. Overall the Bmax measures were also more variable across assays than measures of Kd. There was, however, considerable overlap in both Bmax and Kd values across groups and neither significant main effects of hormone treatment nor significant group differences for either set of values among the 4 or 28 day treatment groups.

