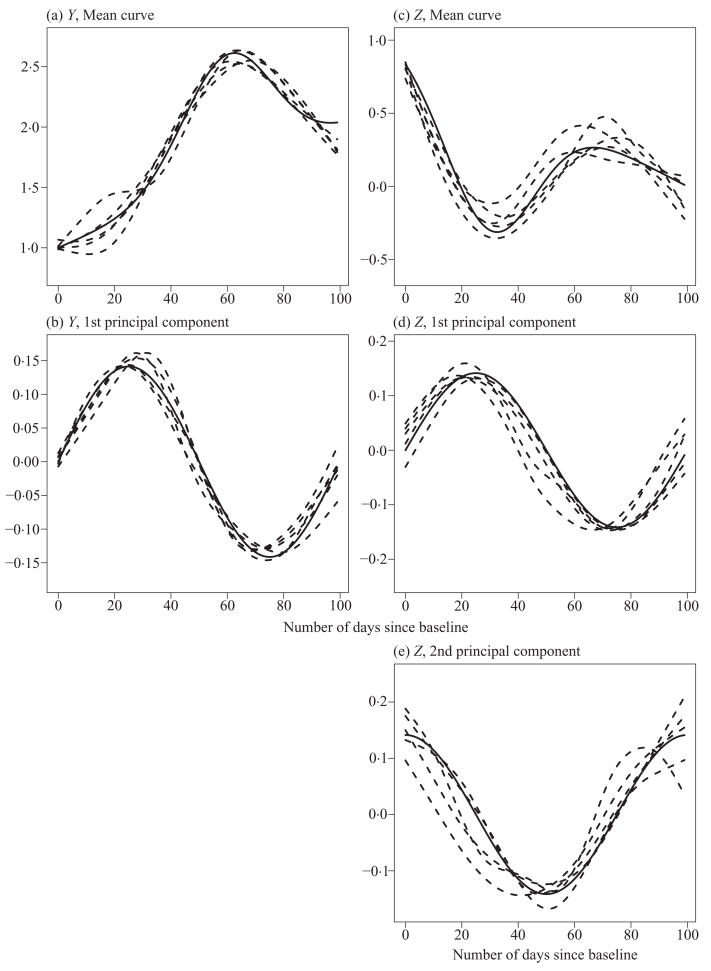
Fig. 1.
Fitted mean curves and principal component curves for five simulated datasets: (a) mean curve of Y, (b) first principal component curve, for Y, (c) mean curve for Z, (d) and (e) first and second principal components for Z.
Solid lines represent true curves and dashed lines represent the fitted curves for the five simulated datasets.

