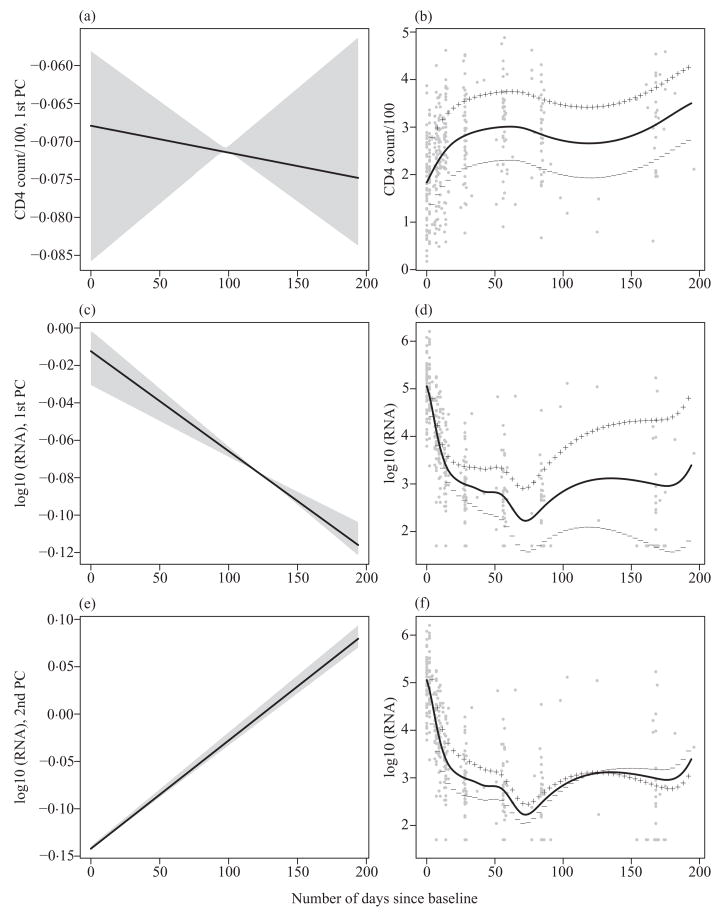
Fig. 3.
AIDS study. Estimated principal component curves for (a) CD4+ cell counts and (c) and (e) viral load with corresponding 95% pointwise confidence intervals. (b), (d) and (f) Effect on the mean curves of adding (plus signs) and subtracting (minus signs) a multiple of each of the principal components, shown on the panels (a), (c) and (e).

