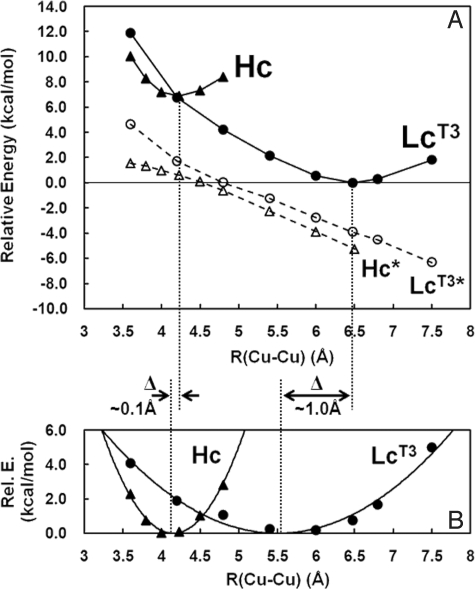
Fig. 4.
PESs of deoxy Hc and deoxy LcT3 along Cu–Cu. (A) PESs of deoxy Hc and deoxy LcT3 with αC constraints are shown as Hc and LcT3 in filled symbols, whereas PESs of deoxy Hc and deoxy LcT3 without αC constraints are shown as Hc* and LcT3* in open symbols. (B) PESs of deoxy Hc and deoxy LcT3, where the energies of Hc* and LcT3* in A are subtracted from those of Hc and LcT3 in A. Symbols are the results of the subtraction, whereas the solid lines are the fit curves using a second-order parabolic function. For comparison of the two PES components, the minima are set as zero in relative energies.

