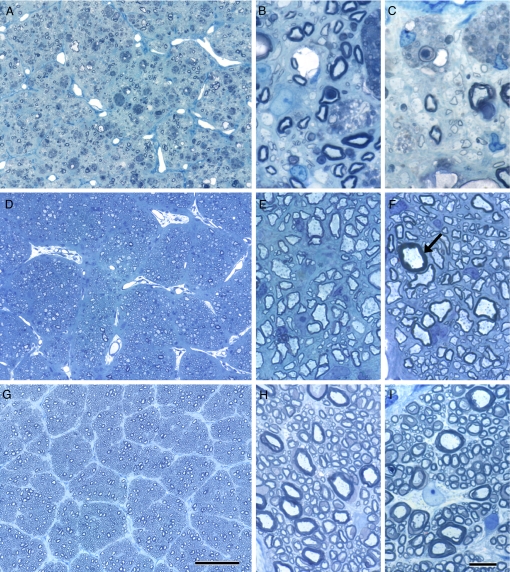
Fig. 2.
Changes in the optic nerve during active disease (A–C), during recovery (D–F), and in controls (G–I). The center of the optic nerve (A) shows almost total myelin loss, representative of changes across the entire optic nerve from the subpial area (B) to the center of the nerve (A and C). Few myelinated fibers remain with many demyelinated axons (arrows) and frequent myelin-filled macrophages (B and C). In contrast, the optic nerve in the recovered cat appears to have an almost normal density of myelinated axons (D–F), although practically all myelin sheaths are thin, both subpial (E) and at the center of the nerve (F) compared with the control cat optic nerve (G–I) sampled at the same levels as the affected and recovered cats (A–F). A single fiber with an intact, thick myelin sheath (F, arrow) represents the only axon not remyelinated. Toluidine blue. (Scale bars: A, D, and G, 100 μm; B, C, E, F, H, and I, 10 μm.)

