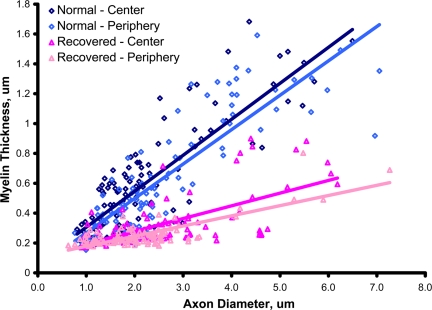
Fig. 3.
Myelin sheath thickness is reduced across the optic nerve. Plot of myelin sheath thickness against axon diameter demonstrates a significant difference at both the periphery and center of the nerve. The regression lines are y = 0.241x + 0.0648 (R2 = 0.6926) for normal center; y = 0.2304x + 0.0376 (R2 = 0.7428) for normal periphery; y = 0.0851x + 0.1088 (R2 = 0.4111) for recovered center; and y = 0.0681x + 0.1096 (R2 = 0.6018) for recovered periphery. The differences between wild-type and recovered cat g-ratio in both the center and periphery of the nerve were calculated as significant by the Mann–Whitney rank sum test (P < 0.001).

