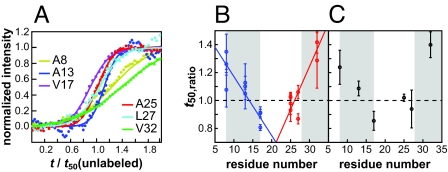
Fig. 4.
Summary of the kinetics for all 6 labeled peptides. (A) Comparison of sample kinetic curves for the isotope-labeled peaks by using the same scaling factors as in Fig. 3E. (B) t50,ratio measured from the individual experiments. (C) Averages of the individual data points in B with weights inversely proportional to the square of individual errors. Error bars were determined with standard error described in Eqs. s4 and s7 in SI Text.

