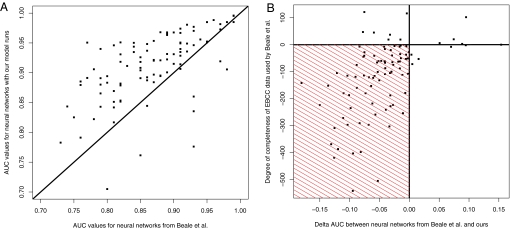
Fig. 1.
Performance of climate envelopes in Beale et al. (1) and in our analysis. (A) AUC values obtained with artificial neural networks (ANN) for each of the 94 bird species modeled [out of 100 species modeled by Beale et al. (1)]. In addition to including more occurrence records per species, our analysis further differs from Beale et al. (1) in that we excluded Iceland, a few grid cells in Russia, and some of the former Soviet Republics. Axis x represents the AUC values obtained by Beale et al. (1) using annual growing degree days, mean temperature of the coldest month, soil water availability, and the coefficient of variation in the mean monthly temperature. Axis y represents AUC values obtained with the same implementation of ANN, but using growing degree days, mean temperature of the coldest month, annual precipitation, and an index of humidity calculated as the ratio of mean annual actual evapotranspiration over the mean annual potential evapotranspiration. (B) Delta between ANN AUC values obtained by Beale et al. (1) and our ANN AUC models with improved data (x), against degree of completeness in the bird species data (y), whereby negative values indicate the number of records missing in Beale et al.'s analysis. The red-shaded area shows where our ANN models yielded higher AUC values over Beale et al. (1) models because of improved completeness of the species distribution data.

