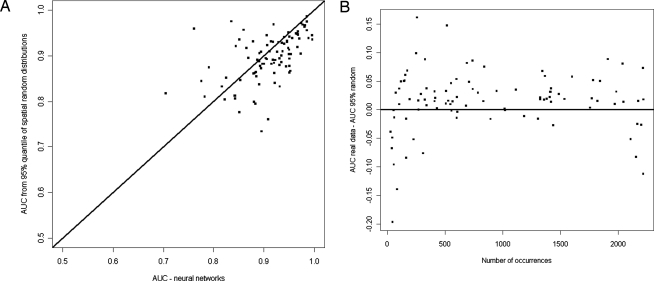
Fig. 2.
Performance of our climate envelopes against the null model. (A) AUC values for real species obtained with our ANN model runs (y axis in Fig. 1A) against the AUC values obtained with a null model that generates virtual species with the same prevalence and spatial structure as the real species (the published null model Beale and colleagues). AUC values for the null distributions are the top 5% scores from random trials (i.e., P < 0.05). When using ANN models with improved response and predictor variables, real models were better than expected by chance 72% of the time [instead of 32% in Beale et al. (1)]. (B) Improvement of AUC scores for ANN models using real data as compared with ANN models with null distributions (top 5% AUC scores from random trials) against range size. Models with real data tend to under-perform with restricted- and wide-ranging species.

