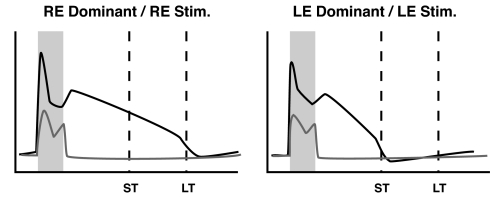
Fig. 1.
Schematic illustration summarizing key features from experimental results. Plots show the firing frequency response of a right-eye (RE) dominant neuron to RE stimulation and a left-eye (LE) dominant neuron to LE stimulation. In the naı̄ve animal, both LE and RE neurons respond (gray lines) only during the period of stimulation (shaded box). During training, LE and RE stimulations are paired with rewards delivered after a short (ST) or long (LT) delay period (dashed lines). After training, neuronal responses (black lines) persist until the reward times paired with each stimulus. See Fig. S1 for examples of real neural activity.

