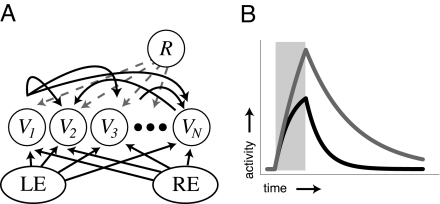
Fig. 2.
Representing time. (A) Network structure. Neurons in the recurrent layer are shown with a subset of the recurrent excitatory synaptic connections (curved black arrows) and labeled with their associated activity levels (Vi). Actual network connectivity is all-to-all. Each neuron also receives external input from the left or right eye. The reward signal (R) projects to all neurons in the recurrent layer. (B) Example neural activity profiles from a single rate-based neuron after stimulation (shaded box) when isolated (black line, no recurrent stimulation, decay rate set by τm) and when embedded in a network with small lateral synaptic weights (gray line, decay rate τdμ). In our model, encoded time is represented by the decay rate of neural activity in the recurrently connected layer.

