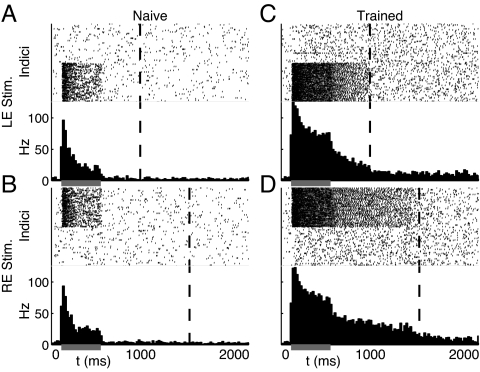
Fig. 4.
RDE with stochastic spiking neurons. Each subplot shows a raster plot for all neurons in the network over the course of a single stimulus evoked response (Upper) and the resultant spike histogram (Lower) indicating the average firing frequency in Hz for the whole network. (A and B) The 2 monocular stimulus patterns elicit brief periods of activity during stimulation (gray bar) in responsive subpopulations of the naı̄ve network that decay before the times of reward (dashed lines) for each input. (C and D) After training with RDE, evoked activity persists until the appropriate reward times.

