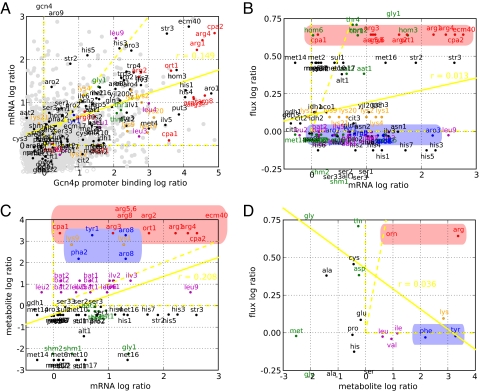
Fig. 2.
Pairwise comparisons of changes often reveal poor correlation in Gcn4p binding, mRNA, flux, and end product metabolite. Induction ratios for the measurements indicated on the axes correspond to Fig. 1. (A) Ratios of mRNAs (measurements described in text) and Gcn4p binding at the upstream promoter under starvation measured with ChIP arrays as described by Harbison, et al. (3) are scattered. As purely Gcn4p-regulated, CPA2 (Upper Right) illustrates a general observation: Stronger binding often leads to increased transcriptional activation. For other genes, the binding relationship gives insight to its transcriptional control and identifies genes (i) bound yet not activated (>2 log2 bound, <0.5 log2 expressed) and (ii) activated yet not bound (<1 log2 bound, >1 log2 expressed). The first class includes genes encoding transcription factors Met4p, Leu3p, and Lys14p, which likely require coactivators, and CPA1, which likely undergoes a uORF-mediated activation of mRNA decay (a metabolite-RNA interaction) (32, 33) by 10-fold increase in free arginine. The second class of genes includes ARO9 that likely have indirect mechanisms of transcriptional activation, for instance, by Aro80p in response to the 2- and 3-fold increases in free phenylalanine (34). (B–D) Log ratios for the mRNA, reaction flux, and metabolite measurements described in the text are associated by pathway and labeled. Arginine and aromatic data, which differ in metabolite interaction densities, are highlighted in red and blue, respectively. Yellow dotted lines highlight the positive x axis, y axis, and diagonal, and the yellow solid line represents the least squares fit of the data. Data points outside the axes were placed at the periphery. (B) Despite similar transcriptional activations, flux measurements diverge for arginine (in red, increased) and aromatic (in blue, invariant) pathways. Generally, transcriptional activation is insufficient in predicting flux activation. (C and D) Free phenylalanine and tyrosine rise 2- and 3- fold upon transcriptional activation, yet aromatic fluxes remains invariant likely because increased product levels modulate pathway activity through a high density of feedback metabolite-enzyme interactions. Overall, a variety of posttranscriptional control (e.g., metabolite interaction density) mechanisms simultaneously modulating pathways confound an effort to correlate mRNA, flux, and metabolite changes.

