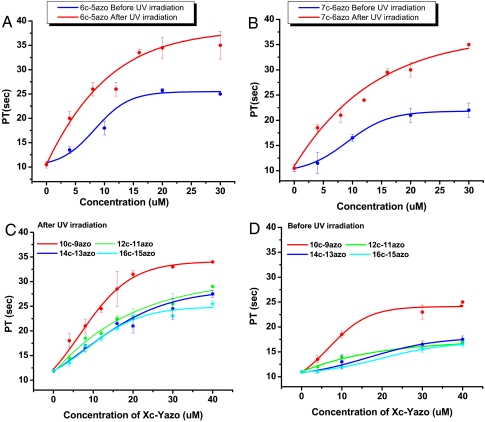
Fig. 3.
PT measurement using each probe -cis and -trans (A–D). Dose–response of 6c-5azo or 7c-6azo -cis and -trans was plotted in each graph (A) or (B), respectively. Dose–responses of 10c-9azo, 12c-11azo, 14c-13azo, and 16c-14azo -cis or -trans are compared (C) or (D), respectively. We then obtained the dose–response curve, and IC200s of each -cis and -trans are summarized in Table 1.

