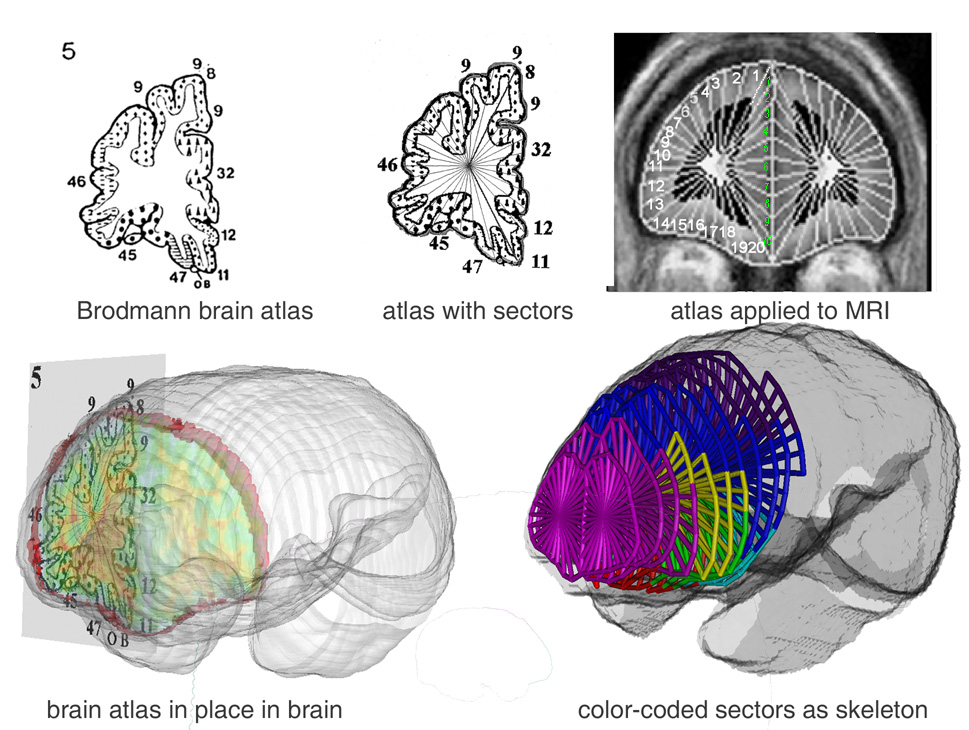
Figure 1. Delineation of cortical Brodmann areas. Upper left: Perry brain atlas for slice #5 showing frontal pole Brodmann areas (e.g., 9, 46, 45…) in raw drawing and with sectors added.

Upper right: Coronal brain edges are traced on individual MRI slices and set of sectors applied by computer algorithm, 20 sectors on the lateral and orbital surface (white numbers) and 10 in the medial portion (green numbers) for a total of 30. Bottom Left: Perry atlas in three-dimensional perspective within MRI surface. Gray and white matter volume within each Brodmann area is calculated. Bottom right: Diagram of frontal Brodmann areas as colored stick diagram: area 10 is magenta, area 9 is blue, area 46 yellow, as example.
