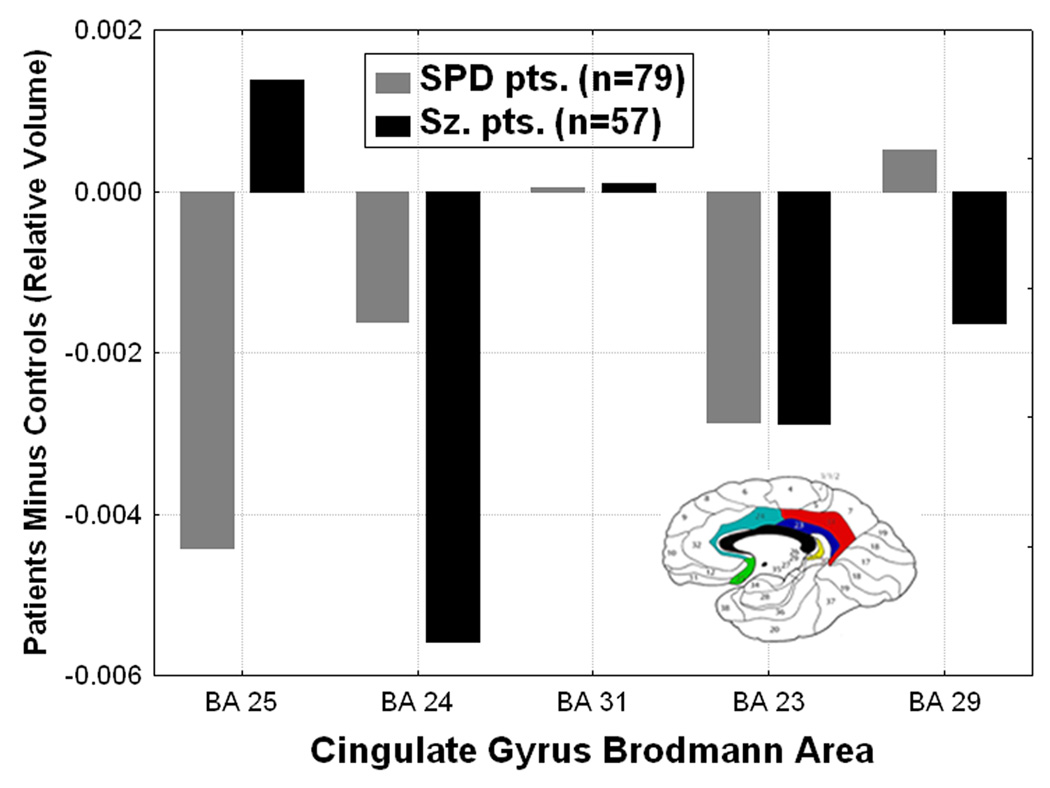
Figure 2.

Differences from normal in cingulate gyrus Brodmann area volumes are shown for the schizophrenia spectrum groups. Compared with healthy controls, the schizophrenia patients showed the greatest cingulate volume reduction in BA 24 and SPD patients were intermediate (Group × Brodmann area interaction, (F[8,556]=2.92, p=0.003, Wilks). Y-axis shows 100×(roi volume/total brain volume) patients minus normals.
