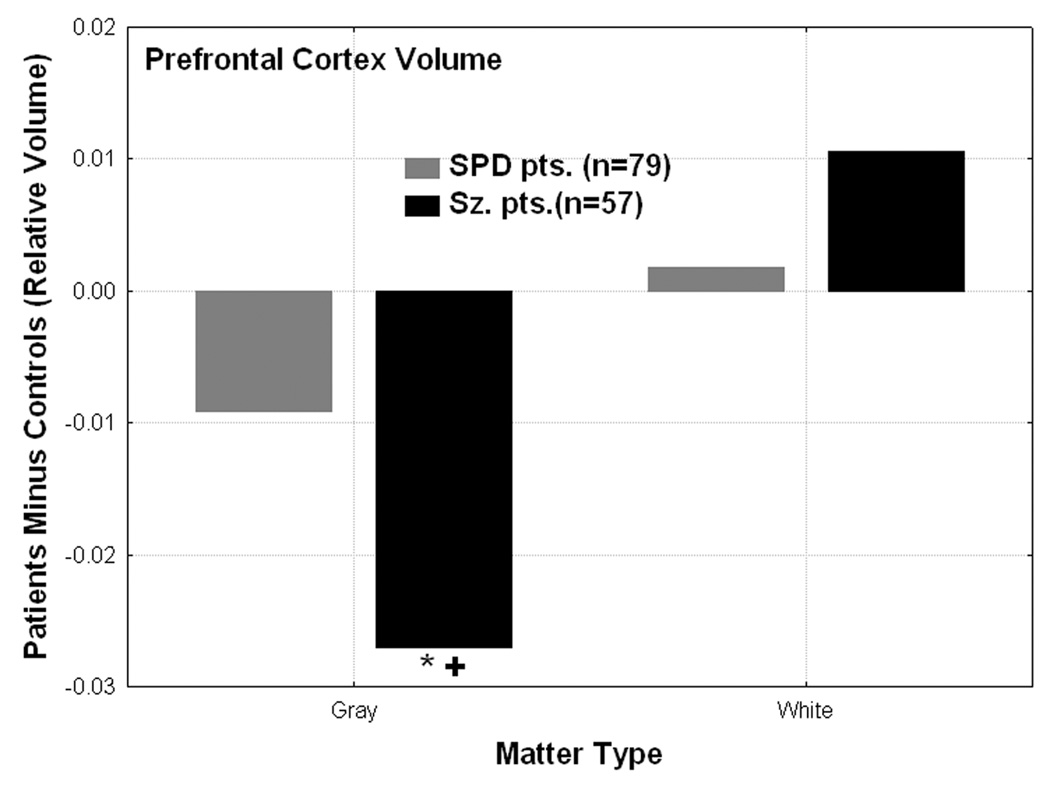
Figure 4.

Gray and white matter prefrontal cortex volume differences from normal are shown for the schizophrenia-spectrum groups. The schizophrenia patients showed significantly reduced gray matter volume in prefrontal cortex (averaged across hemisphere and all 9 prefrontal cortex BAs which include BA 8, 9, 10, 11, 12, 47, 44, 45, 46) compared with the healthy controls (*N>Sz, p=0.00001, Fisher’s test) and SPD patients (“+” denotes SPD>Sz, p=0.009, Fisher’s LSD test). Group × Matter type interaction, F[2,281]=4.09, p=0.018).
