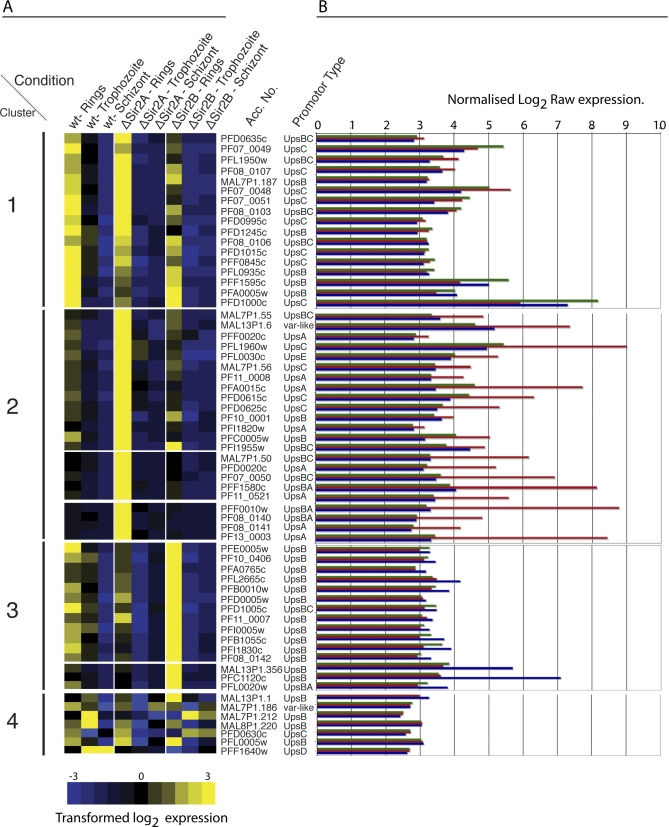
Figure 4. PfSir2 Paralogues Silence Discrete Subsets of var Genes Associated with Conserved Promoter Types That Drive Their Expression.
(A) Unsupervised nonhierarchical Gaussian self-clustering analysis was performed in order to understand the relationship between var gene subtypes and the role of PfSir2 paralogues in their regulation. Genes were clustered by similarity using Pearson coefficients. Heatmap colour-scale values were assigned by ArrayMiner after further transformation of expression data (see Material and Methods for details) with +3 (yellow) being the highest expression and −3 (blue) being the lowest expression. Expression profiles of the var gene repertoire were grouped given the nine conditions examined by Affymetrix arrays (i.e., rings, trophozoites, and schizonts in 3D7 [wildtype], ΔPfSir2A, and ΔPfSir2B parasite lines). The heatmap clearly identifies three major clusters that are biologically relevant. Cluster 1 represents var genes that are expressed in standard culture conditions in 3D7 parasite isolate and are somewhat expressed in PfSir2-disrupted parasites. No correlation in promoter type is seen in var genes found is this cluster with the exception that no UpsA-var genes were found there. Var genes controlled by UpsA conserved promoter type are found within cluster 2 as are most of the internally located UpsC var genes. This finding suggests that PfSir2A plays a suppressive role in expression of var genes with an UpsA or UpsC promoter type. Cluster 3 contains almost exclusively UpsB var genes and these are de-repressed in the absence of PfSir2B. This suggests that PfSir2B is involved in the suppression of the most telomere proximal, UpsB driven var genes. Cluster 4 contains several var genes that seem to be outliers, not conforming or reaching the threshold required to fall into one of the three main clusters. Scale bar of expression goes from −3 to 3 in transformed log2 expression.
(B) Raw normalised log2 expression of all var genes in ring-stage parasites aligned with their corresponding heatmap in the Gaussian self-clustering analysis. Raw normalised expression values for all var genes grouped by their promotor type as assayed by array analysis can be viewed in Figure S4. The colour of each bar refers to its strain identity: green, 3D7; red, ΔPfSir2A; blue, ΔPfSir2B.

