
Figure 6.
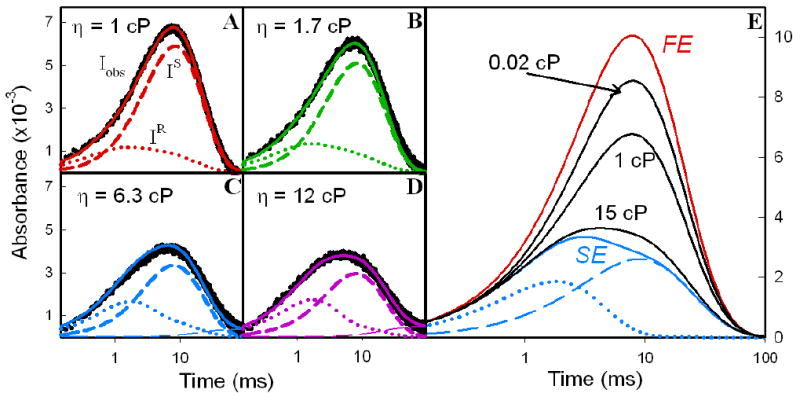
(a-d) Experimental I timecourses (black) at η = 1, 1.7, 6.3, and 12 cP overlaid with simulated KD traces (solid lines) calculated with final parameters in Table 1. Below each trace is its decomposition into conformers, IS (short dashed line) and IR (dotted line). As in Fig 5A, agreement between the long-time tails of experimental and calculated traces requires a slight contribution from [α1(ZnP+)β2(Fe3+)/α2(ZnP)β1(Fe2+)] dimer pairs that form by dissociation of tetrameric I; these do not recombine to tetramers and undergo back ET on the timescale of these experiments (see Supporting Information). (e) Evolution of I progress curves from FE limit to SE limit; calculations use final parameters in Table 1.