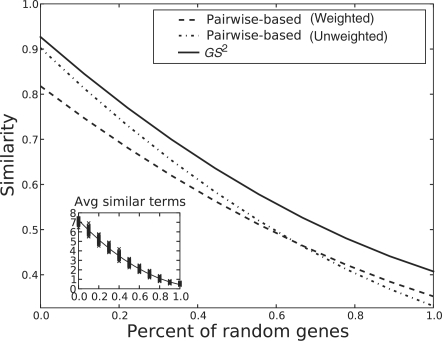
Fig. 5.
The similarity measured by the three methods, on sets of 100 genes, with varying degrees of relatedness among the genes in a set. The x-axis shows the percentage of the gene set replaced by random genes. ‘Pairwise-based’ refers to the method by Wang et al. (2007) when plugged into the set similarity calculation given in Equation (1).

