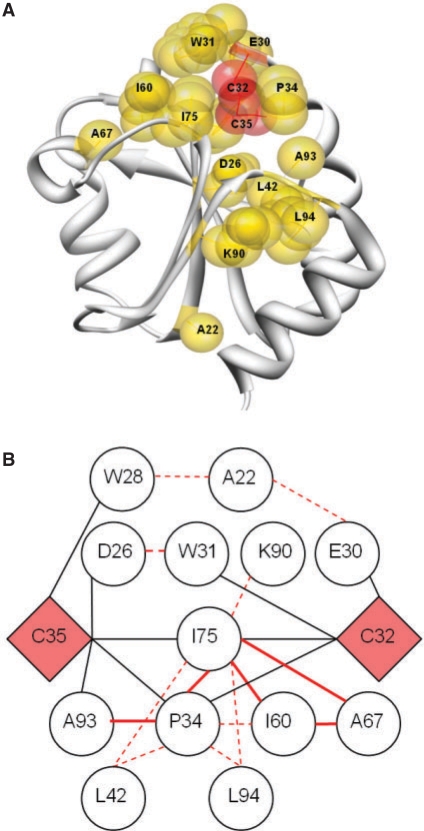
Fig. 3.
(A) Ribbon representation of 2TRX. Represented as gold spheres, 14 of the 20 highest Z-score transformed MI scoring pairs of residues are shown. Orange spheres: catalytic C32 and C35. Molecular graphic images were generated using UCSF Chimera package (University of California; Meng et al., 2006). (B) Schematic representation of the 14 pairs of interactions scoring highest in Z-score transformed MI values. Red lines are high MI scoring residue pairs. Full lines denote physical contact (Cβ distance <8 Å).

