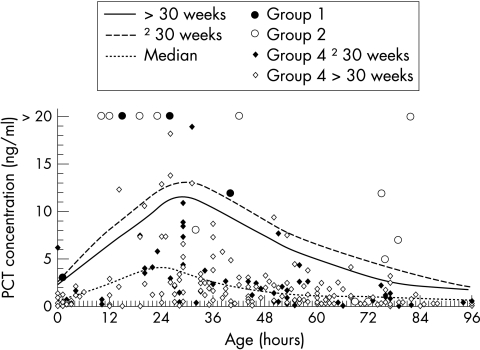
Figure 1 Age related nomogram for procalcitonin (PCT) concentrations during the first 4 days of life in preterm infants. PCT concentrations of 283 samples drawn from healthy preterm infants (group 4), four samples from infants with confirmed sepsis (group 1), and 12 from infants with suspected sepsis (group 2) were plotted from birth to 96 hours of life. The continuous and dashed lines represent the 95th centile of infants 24–30 and 31–36 weeks gestation respectively. The dotted line represents the median of all group 4 samples. For simplicity, eight values for groups 1 and 2 that exceeded 20 ng/ml were plotted as >20 ng/ml (26 and 34 ng/ml in group 1 and 24, 36, 110, 58, 202, and 56 ng/ml in group 2).

An official website of the United States government
Here's how you know
Official websites use .gov
A
.gov website belongs to an official
government organization in the United States.
Secure .gov websites use HTTPS
A lock (
) or https:// means you've safely
connected to the .gov website. Share sensitive
information only on official, secure websites.
