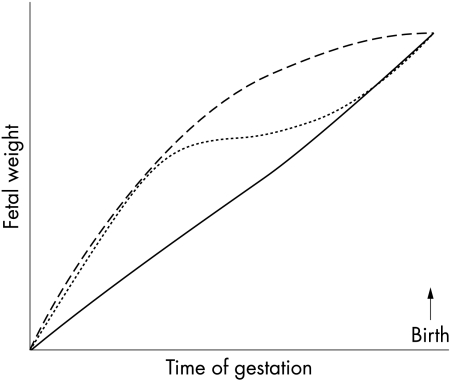
Figure 1 Different fetal growth trajectories resulting in similar birth weights. The graph shows three exaggerated hypothetical growth trajectories: rapid growth in the first half of pregnancy with slowing thereafter (long dashed line); a similar initial trajectory followed by a period of slow growth before there is intrauterine catch‐up growth (short dashed line); initially slower growth with acceleration in the last half of gestation (solid line).

An official website of the United States government
Here's how you know
Official websites use .gov
A
.gov website belongs to an official
government organization in the United States.
Secure .gov websites use HTTPS
A lock (
) or https:// means you've safely
connected to the .gov website. Share sensitive
information only on official, secure websites.
