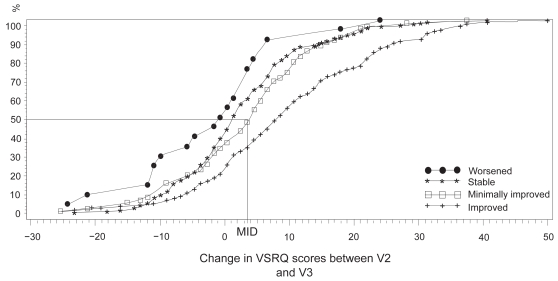
Figure 3.
Cumulative response curves according to the evolution of dyspnea for the four health groups defined from the dyspnea Overall Treatment Effect questionnaire. ‘Worsened patients’, n = 30; ‘stable patients’, n = 185; ‘minimally improved’, n = 83; ‘improved’, n = 116.
Abbreviations: MID, minimal important difference = 3.5. and VSRQ is not

