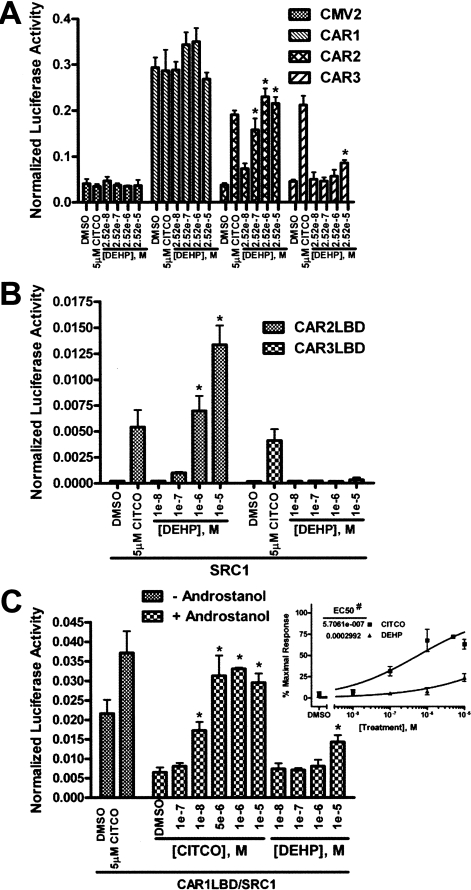
Fig. 4.
Transactivation and coactivator recruitment by CAR1, CAR2, and CAR3 in response to DEHP. All transfections were done in COS-1 cells using media containing 8% charcoal/dextran-treated FBS and included the 3.1-RXRα expression vector (A) or the 3.1-RXRαLBD expression vector (B and C) as well as the pRL-CMV vector for normalization of transfection efficiency. Data are represented as normalized luciferase values, and each data point represents the mean (± S.D.) of four separate transfections. A, cells were transfected with the 2B6XREM reporter and CMV2 or CMV2-CAR1, 2, or 3 and treated for 24 h. B, cells were transfected with pFR-Luciferase, pM-SRC1, and VP16-CAR2LBD or VP16-CAR3LBD expression vectors and treated for 24 h. C, cells were transfected with pFR-Luciferase, pM-SRC1, and VP16-CAR1LBD expression vector and treated for 24 h. The inset shows the “+ androstanol” data plotted as a dose-response curve. A 100% response was defined as the reporter activity in the presence of 5 μM CITCO (without androstanol) and a 0% response was defined as the reporter activity in the presence 10 μM androstanol (without CITCO or DEHP). *, data points that were significantly different from their respective DMSO control as determined by ANOVA in combination with a Dunnett's multiple comparison post test (p < 0.01). #, difference in the LogEC50 values was statistically significant as determined by F test (p < 0.0001).

