Fig. 2.
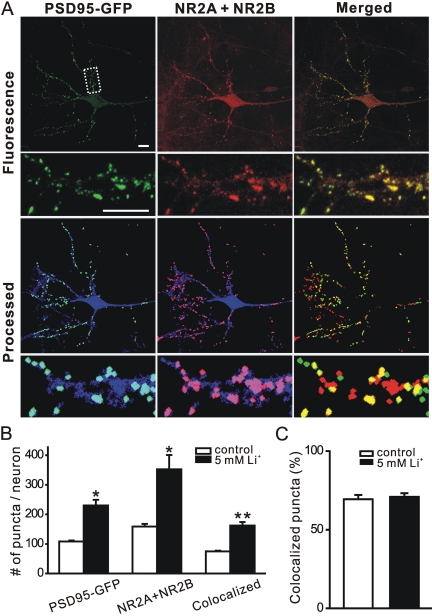
New PSD95-GFP puncta induced by lithium represent synaptic sites. A, confocal micrographs display NR2A and NR2B (red) immunoreactivity and PSD95-GFP fluorescence (green). Processed images display puncta within the DsRed2 mask (blue). The image-processing algorithm described under Materials and Methods was used to identify NR2 immunoreactive puncta and PSD95-GFP puncta. Merged images display overlapping puncta (yellow). The insets are enlarged images of the boxed region. Note that NR2A and NR2B immunoreactivity includes nontransfected cells in the field. Scale bar, 10 μm. B, quantification of PSD95-GFP puncta, NR2A, and NR2B, and PSD95-GFP puncta colocalized with NR2A and NR2B for neurons under control conditions (□) and after treatment with 5 mM lithium (▪). Data are presented as mean ± S.E.M. *, p < 0.05, **, p < 0.01, lithium-treated compared with control. C, bar graph shows the percentage of PSD95-GFP puncta colocalized with NR2A and NR2B under control conditions (□) and after 4-h treatment with 5 mM lithium (▪). Data are presented as mean ± S.E.M.

